Why meals make hills
On this page
Bread, rice, pasta and potatoes are starch, and starch is glucose linked in chains, so they raise blood sugar like sugar does. A cup of white rice makes a bigger hill than a can of cola. Protein, vegetables and fat on the same plate slow the hill down, and eating the carbs last made the peak about 46% lower in one trial.
What we’d do
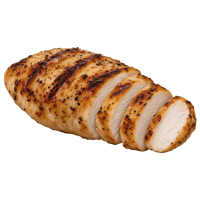
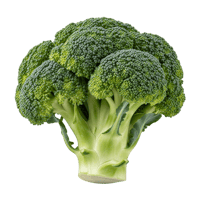
Build each meal around protein and vegetables, and eat those first. Then the carbs. Pick the less milled version when you can, like rolled oats over instant, a grainy loaf with seeds you can see over plain whole wheat, and pasta or beans over rice when you want a starch. Keep fruit whole and skip juice and sugary drinks. If you want dessert, have it right after dinner, not as a snack on its own. And stop judging a food by one spike. A hill after a meal is normal.
If you remember three things
- Starch counts as sugar. A cup of white rice carries about 44 grams of carbs you digest, more than a can of cola.
- How fine the grain is milled changes the hill more than its color. White and whole wheat bread score 75 and 74.
- Protein and vegetables first, carbs last. Same food, smaller hill.
Why does rice raise blood sugar more than soda?
Most people sort food into sweet and not sweet, and assume only the sweet side raises blood sugar. The bowl of rice with sushi or curry feels safe and the soda feels dangerous. People wearing a sensor are often shocked the first week, because the rice makes the bigger hill.
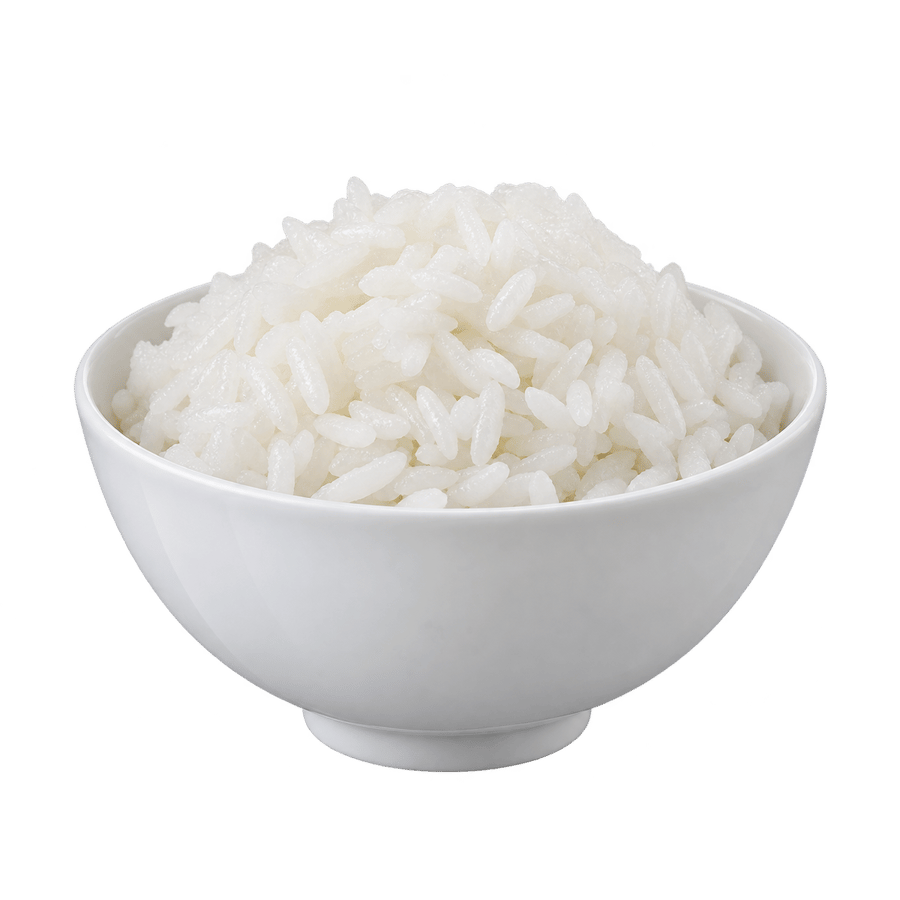
Starch is glucose molecules linked in long chains, like beads on a string. Your gut cuts the string and the beads go into your blood as glucose. A cup of cooked white rice has about 45 grams of carbs and less than 1 gram of fiber, so about 44 grams that end up as glucose. A 12-ounce can of cola has 39 grams of sugar. By glycemic load, which counts both how fast a food raises blood sugar and how much of it you eat, the rice comes out at about 32 and the cola at about 23.
None of that makes cola a better choice. The cola has nothing else in it, and each daily sugary drink went with 13% more type 2 diabetes over years, even after adjusting for bodyfat. It means the rice deserves the same respect.
What is the glycemic index?
The glycemic index (GI) ranks foods by how much a fixed amount of their carbs raises blood sugar, with pure glucose at 100. Low is 55 or less and high is 70 or more. Glycemic load (GL) adjusts for the portion. It’s GI times the grams of carbs you digest in a serving, divided by 100. GL is closer to what happens on your plate.
The international tables, compiled in 2008 from studies around the world, hold some surprises.
| Food | GI | What it shows |
|---|---|---|
| White bread | 75 | Fine flour comes apart fast |
| Whole wheat bread | 74 | The same flour, milled just as fine, scores the same |
| Specialty grain bread | 53 | Grains you can still see come apart slower |
| Instant oat porridge | 79 | Same grain as rolled oats, cut finer |
| Rolled oat porridge | 55 | |
| White rice | 73 | |
| Brown rice | 68 | Close to white |
| White spaghetti | 49 | Pasta sits low |
| Boiled potato | 78 | |
| French fries | 63 | Lower than boiled, because fat slows it |
| Lentils | 32 | Beans and lentils sit near the bottom |
| Cornflakes | 81 | |
| Rice crackers | 87 | Near the top of the whole table |
| Ice cream | 51 | Lower than rice crackers, and still ice cream |
| Orange | 43 | |
| Orange juice | 50 | |
| Honey | 61 | About the same as table sugar, 65 |
The authors of the table wrote that “the GI should not be used in isolation”. Ice cream and chocolate score low because of their fat, and fries beat a boiled potato for the same reason, which says nothing about what’s good for you. Use GI to pick between two versions of the same food, like rolled and instant oats, and use your sense for the rest. Test yourself in Which spikes more?
What makes a hill smaller?
Protein, vegetables and fat on the same plate. Fat lowers a food’s score, which is why fries come in under a boiled potato, and protein and vegetables eaten first lower the peak, as the next trial shows.
Eating the carbs last. In a 2019 trial, 15 adults with prediabetes ate the same meal three ways on three days. When they ate the protein and vegetables first and the carbs 10 minutes later, the peak was about 46% lower than when they ate the carbs first, and the total rise 39% lower. Same food, different order. It’s also why dessert after a full meal makes a smaller hill than the same sweet eaten alone.
Less milled grains. Grains you can still see, pasta and beans come apart slower than fine flour and puffed or flaked cereals.
A walk right after. Ten minutes of walking after each meal made the rise after eating 12% smaller than one 30-minute walk a day, and 22% smaller after dinner. See movement.
Try the plate yourself. Pick the carbs, then switch on carbs last, a walk or a short night.
- Available carbs
- 44 g
- GI
- 73
- Glycemic load
- 32
Carbs from USDA FoodData Central 168878 (Rice, white, long-grain, regular, enriched, cooked), 1 cup cooked. GI from the international tables (Atkinson 2008). Glycemic load is GI times available carbs over 100.
White rice makes a bigger hill than a can of cola: a load of 32 against 23. Starch is glucose in chains.
People differ. In 800 people eating the same meals, the hills came out very different (Zeevi 2015).
Photograph each meal and Gyroscope logs its carbs, fiber and sugar.
Why does the same meal spike me and not my friend?
People differ, a lot. In 2015, researchers in Israel tracked 800 people through 46,898 meals with sensors and found that identical meals gave very different responses from person to person. Blood tests, body measurements, activity and gut bacteria all helped predict who would respond how.
That’s the best use of a sensor for someone without diabetes, two weeks of comparing your own meals with each other. Comparing your numbers with someone else’s, or with a perfect flat line, says much less. Sensors also run high. In 15 healthy adults, a FreeStyle Libre 2 put a smoothie’s GI at 69 when fingertip blood said 53.
Are hills after meals bad?
A hill is your body doing its job. In 153 healthy people aged 7 to 80 wearing a sensor, the typical person spent about 30 minutes a day above 140 mg/dL and 96% of the day between 70 and 140. Nobody has run a trial showing that flattening normal hills helps people without diabetes. What predicts trouble is a high A1c and a high 2-hour number after the lab’s glucose drink. More on whether every spike is bad.
Do you need to cut carbs?
No. The ADA’s 2026 standards say there’s no ideal share of calories from carbs, protein or fat for preventing diabetes, and name both Mediterranean and low carb eating as options. The trial that cut new diabetes by 58% used a low-fat diet. Pick the pattern you can keep, cut the refined carbs and sweet drinks first, and keep fruit, beans and whole grains. More on cutting carbs and fruit.
meals.guide covers the plate itself, including how the order of your food changes a meal.
10 sources
- Atkinson FS, Foster-Powell K and Brand-Miller JC, International tables of glycemic index and glycemic load values 2008, Diabetes Care, 2008pmc.ncbi.nlm.nih.gov
- USDA National Nutrient Database, Rice, white, long-grain, regular, enriched, cooked, via NutritionValue.orgnutritionvalue.org
- Harvard T.H. Chan School of Public Health, The Nutrition Source, Added sugar in the dietnutritionsource.hsph.harvard.edu
- Shukla AP and others, Carbohydrate-last meal pattern lowers postprandial glucose and insulin excursions in type 2 diabetes and prediabetes, Diabetes, Obesity and Metabolism, 2019pubmed.ncbi.nlm.nih.gov
- Zeevi D and others, Personalized nutrition by prediction of glycemic responses, Cell, 2015pubmed.ncbi.nlm.nih.gov
- Hutchins KM and others, Continuous glucose monitor overestimates glycemia, with the magnitude of bias varying by postprandial test and individual, American Journal of Clinical Nutrition, 2025pmc.ncbi.nlm.nih.gov
- Muraki I and others, Fruit consumption and risk of type 2 diabetes: results from three prospective longitudinal cohort studies, BMJ, 2013, with correctionpmc.ncbi.nlm.nih.gov
- Imamura F and others, Consumption of sugar sweetened beverages, artificially sweetened beverages, and fruit juice and incidence of type 2 diabetes, BMJ, 2015pmc.ncbi.nlm.nih.gov
- Shah VN and others, Continuous glucose monitoring profiles in healthy nondiabetic participants, Journal of Clinical Endocrinology and Metabolism, 2019pmc.ncbi.nlm.nih.gov
- American Diabetes Association, Standards of Care in Diabetes 2026, section 3, Prevention or Delay of Diabetespmc.ncbi.nlm.nih.gov