Flatten the hill
One plate, three switches. Watch the hill after the meal grow and shrink, and see a cup of rice beat a can of cola.
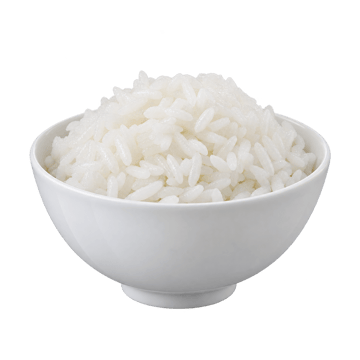
- Available carbs
- 44 g
- GI
- 73
- Glycemic load
- 32
Carbs from USDA FoodData Central 168878 (Rice, white, long-grain, regular, enriched, cooked), 1 cup cooked. GI from the international tables (Atkinson 2008). Glycemic load is GI times available carbs over 100.
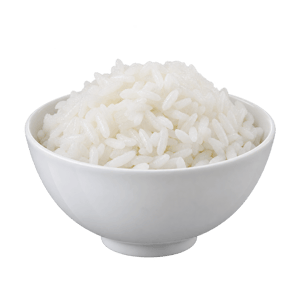
White rice makes a bigger hill than a can of cola: a load of 32 against 23. Starch is glucose in chains.
People differ. In 800 people eating the same meals, the hills came out very different (Zeevi 2015).
Photograph each meal and Gyroscope logs its carbs, fiber and sugar.
How it works
The hill's height is the plate's glycemic load: its GI times the grams of available carbs in a serving, over 100. The GI values come from the international tables, and the carbs from USDA FoodData Central, so the hill is relative, not a blood sugar number in mg/dL.
Each switch is drawn at the size its own trial found, on its own outcome. Carbs last lowered the peak by more than 40% in 15 people with prediabetes. Ten-minute walks after meals lowered after-meal glucose by 12% against one 30-minute walk a day, and by 22% after dinner, in 41 adults with type 2 diabetes. Nobody has tested the two together, so turning on both shows the bigger one, never the two added up.
A short night pushes the other way. A week of 5-hour nights cut insulin sensitivity by 11% in healthy men, and one 4-hour night by about 25%. No trial measured one meal after one short night, so the taller hill is drawn for direction only.
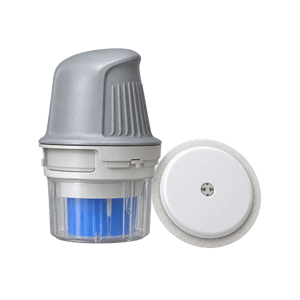
Your own hills can come out very different from anyone else's. In 800 people eating the same meals, the responses varied a lot. A sensor worn for two weeks shows your own.
8 sources
- Atkinson FS, Foster-Powell K, Brand-Miller JC, International tables of glycemic index and glycemic load values, Diabetes Care, 2008pmc.ncbi.nlm.nih.gov
- US Department of Agriculture, FoodData Central, SR Legacy rows 168878, 174925, 173905, 171675, 170440, 169737 and 174852fdc.nal.usda.gov
- Shukla and others, food order in 15 adults with prediabetes, Diabetes, Obesity and Metabolism, 2019pubmed.ncbi.nlm.nih.gov
- Reynolds AN and others, Advice to walk after meals is more effective for lowering postprandial glycaemia in type 2 diabetes than advice that does not specify timing, Diabetologia, 2016pubmed.ncbi.nlm.nih.gov
- Engeroff T, Groneberg DA, Wilke J, After dinner rest a while, after supper walk a mile? Sports Medicine, 2023pubmed.ncbi.nlm.nih.gov
- Buxton OM and others, Sleep restriction for 1 week reduces insulin sensitivity in healthy men, Diabetes, 2010pubmed.ncbi.nlm.nih.gov
- Donga E and others, A single night of partial sleep deprivation induces insulin resistance in multiple metabolic pathways in healthy subjects, Journal of Clinical Endocrinology and Metabolism, 2010pubmed.ncbi.nlm.nih.gov
- Zeevi D and others, Personalized nutrition by prediction of glycemic responses, Cell, 2015pubmed.ncbi.nlm.nih.gov