The blood sugar meal index

How much a meal raises your blood sugar comes down mostly to one thing: how much sugar and starch you eat in one go. Then how fast it gets in. We ranked 248 everyday meals by both at once, using the carbs the USDA lists for each and the GI scientists measured, and every row shows its sources.




The swaps that change the most
Most of the gap between the top and the bottom of the index is one or two foods on the plate: a drink, a pile of rice or a second helping of bread. These are the same meals with the one swap that matters most.
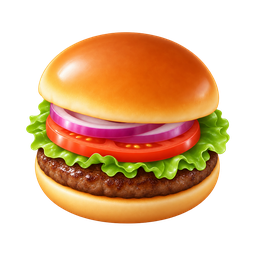 Large cheeseburger, large fries and a 32 oz cola load 128
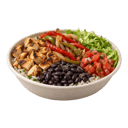
The cheeseburger on its own: load 20 General Tso's chicken with fried rice load 85
Beef and broccoli with a cup and a half of white rice: load 49 Pancakes, syrup and a glass of orange juice load 68
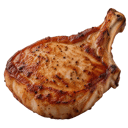
Two eggs and one slice of whole wheat toast: load 8
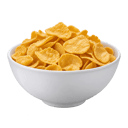 Cornflakes with milk load 42
Rolled oats with berries and walnuts: load 16
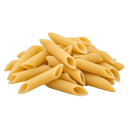 Restaurant plate of spaghetti bolognese load 46
A moderate plate of whole wheat pasta with olive oil and vegetables: load 22
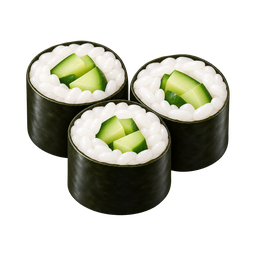 Salmon sushi rolls, 12 pieces load 32
Sashimi with miso soup: load 0 Chicken biryani load 46
Dal with one cup of basmati rice: load 38
 A 32 oz fountain cola load 61
A 12 oz can: load 22
How the index is built
Blood sugar after a meal follows mostly how much sugar and starch you eat, and second, how fast it gets into your blood. The glycemic load puts both in one number: the food's glycemic index times the grams of carbs you digest in the serving, divided by 100.
The carbs for every meal come from the USDA's Nutritive Value of Foods, by item number, with the fiber taken out. The GI comes from the international tables (Atkinson 2008) or from the University of Sydney's GI database, with the study each value came from. When a dish was tested whole, like salmon sushi or chicken biryani, the index uses that number. Otherwise each carb food on the plate brings its own load, and the loads add up. Open "What it rests on" on any row to see the rows behind it.
Some foods have no GI test of their own, like a burger bun or a waffle. Those borrow the GI of the closest tested food and carry an "est." mark. Working out a meal from its parts tends to run high: in a study of 30 people, three meals with chicken, vegetables and sauce came out 22 to 50% lower when tested whole than the parts predicted. Meals with protein and fat probably make smaller hills than their load says.
The "in colas" column uses a 12 oz can of cola as the yardstick, a load of 22. People also differ a lot. In 800 people eating the same meals, the hills came out very different. The order is still a good guide to which meals push hardest, and a sensor worn for two weeks shows your own.
Why "mostly how much"
Every serving's load is its carbs times its GI. Across this index, carbs vary from zero to about 200 g a meal, while most GIs sit between 40 and 80. So the amount of starch and sugar moves the load far more than the type does, and the GI decides the order among meals of a similar size. That's the core idea of the guide, and you can watch it play out in the simulator and in what happens when you eat.
5 sources
- US Department of Agriculture, Agricultural Research Service, Nutritive Value of Foods, Home and Garden Bulletin 72, 2002ars.usda.gov
- Atkinson FS, Foster-Powell K and Brand-Miller JC, International tables of glycemic index and glycemic load values, Diabetes Care, 2008pmc.ncbi.nlm.nih.gov
- University of Sydney, Glycemic Index Research and GI Database, accessed November 15, 2026glycemicindex.com
- Dodd H and others, Calculating meal glycemic index by using measured and published food values compared with directly measured meal glycemic index, American Journal of Clinical Nutrition, 2011ourarchive.otago.ac.nz
- Zeevi D and others, Personalized nutrition by prediction of glycemic responses, Cell, 2015pubmed.ncbi.nlm.nih.gov