Watch a meal turn into blood sugar
Pick a meal, press eat, and follow the sugar from your stomach into your blood and out to your liver, muscle and brain. Speed it up to 100 times, add a walk or eat the carbs last, and watch the hill change.
 Mouth
 Stomach67 g to go
 Small intestine0.0 g absorbed
 Blood90 mg/dL
 Pancreasresting
 Liver0.0 g stored
 Brain0.1 g used
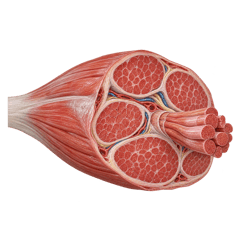 Muscle0.0 g
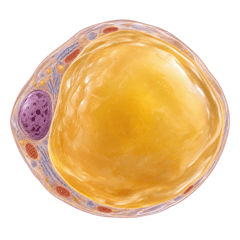 Fat0.0 g
A teaching model built from published averages for a healthy adult. It isn't a prediction for you or anyone, and it can't diagnose anything. Real people eating the same meal differ a lot.
How the model works
It's a teaching model for a healthy adult, built from published averages. It shows how meals differ and what a walk or the order of your plate does. It isn't a prediction for you, and it can't diagnose anything. The bands come from the ADA's 2026 standards: under 140 mg/dL two hours after the lab's glucose drink is normal.
The calibration. In 15 healthy adults, a 50 g glucose drink raised fingertip blood sugar to a peak of 8.1 mmol/L (146 mg/dL) about 29 minutes in. The model starts every meal from a fasting 90 mg/dL and draws that drink as its reference hill.
The size of the hill. A food's GI is the area under its 2-hour curve against glucose for the same carbs, so the model draws each meal's area as its glycemic load over 50. That's why the amount of starch and sugar moves the curve the most.
The shape. Drinks peak first (about 29 minutes), carbs eaten on their own a little later (40), and carbs eaten with protein, fat or vegetables later still (50). A healthy body answers a big meal with more insulin, so above a 70 mg/dL rise the model makes the hill last longer instead of taller.
The switches. Each one is drawn at its own trial's size. Ten-minute walks after meals made the rise 12% smaller than one daily walk, and 22% smaller after dinner (41 adults with type 2 diabetes). Protein and vegetables first, carbs 10 minutes later, lowered the peak by more than 40% (15 adults with prediabetes). A week of 5-hour nights cut insulin sensitivity by 11% in 20 healthy men, which the model draws as a dashed hill 11% bigger, for direction only. Nobody has tested the walk and carbs last together, so the model never adds them.
Where the sugar goes. Your blood holds only about 4.5 g of sugar at 90 mg/dL, about a teaspoon, so almost everything a meal brings in has to leave the blood within a couple of hours. The liver takes 35% of what arrives from the gut on its first pass (30 to 40% of an oral glucose load in the studies) and stops releasing its own. Your body burns about 0.14 g a minute at rest, and 72% of that goes to tissues that don't need insulin, mostly the brain. Of the sugar insulin moves, about 80% goes into muscle and under 5% into fat. During a walk, working muscle takes nearly all of it without waiting for insulin.
What it leaves out. People differ a lot: in 800 people eating the same meals, the hills came out very different. Fructose, alcohol, stress hormones, the time of day and a meal eaten an hour earlier all change real curves. A sensor worn for two weeks shows your own, and how to measure it covers what a sensor can and can't tell you.
Every meal comes from the meal index, with its carbs from the USDA and its GI from published tests. Read what happens when you eat for the trip told stop by stop, and the guide for why it's mostly about how much.
9 sources
- Hutchins KM and others, Continuous glucose monitor overestimates glycemia, with the magnitude of bias varying by postprandial test and individual, American Journal of Clinical Nutrition, 2025pmc.ncbi.nlm.nih.gov
- Atkinson FS, Foster-Powell K and Brand-Miller JC, International tables of glycemic index and glycemic load values, Diabetes Care, 2008pmc.ncbi.nlm.nih.gov
- DeFronzo RA and Tripathy D, Skeletal muscle insulin resistance is the primary defect in type 2 diabetes, Diabetes Care, 2009pmc.ncbi.nlm.nih.gov
- Reynolds AN and others, Advice to walk after meals is more effective for lowering postprandial glycaemia in type 2 diabetes than advice that does not specify timing, Diabetologia, 2016pubmed.ncbi.nlm.nih.gov
- Shukla AP and others, The impact of food order on postprandial glycaemic excursions in prediabetes, Diabetes, Obesity and Metabolism, 2019pubmed.ncbi.nlm.nih.gov
- Buxton OM and others, Sleep restriction for 1 week reduces insulin sensitivity in healthy men, Diabetes, 2010pubmed.ncbi.nlm.nih.gov
- American Diabetes Association, Standards of Care in Diabetes 2026, section 2pmc.ncbi.nlm.nih.gov
- Zeevi D and others, Personalized nutrition by prediction of glycemic responses, Cell, 2015pubmed.ncbi.nlm.nih.gov
- US Department of Agriculture, Agricultural Research Service, Nutritive Value of Foods, Home and Garden Bulletin 72, 2002ars.usda.gov