
Is every blood sugar spike bad for you?
Short answerNot the way you think
On this page
Not the way the spike charts say. Healthy people’s sensors go over 140 mg/dL every day, for about 30 minutes in one study and about 3 hours in another. What predicts trouble is a high A1c and a high 2-hour number after the lab’s glucose drink. Nobody has shown that flattening normal hills after meals helps people without diabetes.
What we’d do
Get a lab A1c and fasting glucose, and judge yourself by those. If you wear a sensor, use it for two weeks to compare your own meals with each other, and ignore the daily score. Take 5 to 27 mg/dL off what it shows for a likely fingertip number. Worry about the pattern, like most meals sending you well over 180 or a rising A1c, not about one 160 after a bowl of pasta.
If you remember three things
- Healthy people go over 140 every day, for anywhere from about half an hour to 3 hours.
- A sensor runs high. In one trial it made time over 140 look 4 times bigger than fingertip blood said.
- The lab numbers predict trouble. A sensor peak after dinner hasn’t been shown to.
Why do people think every spike is bad?
Sensors arrived for people without diabetes in the last few years, and with them a whole genre of charts. A flat line is good, a sharp peak is bad, and the goal is a day with no hills at all. Apps score your day. Some give your meals a grade. A 155 after oatmeal shows up in red, and it’s hard not to take that personally.
Part of it sounds right. People with diabetes do have bigger and longer highs, and very high blood sugar does damage over years. It’s a short step from there to thinking every hill is a small dose of harm, and nobody has tested that step.
What does a normal day look like on a sensor?
Two studies put blinded sensors, ones the wearer couldn’t see, on people whose blood tests were normal.
153 healthy people aged 7 to 80
Dexcom G6 for up to 10 days. Shah and colleagues, 2019
Average glucose 98 to 99 mg/dL. The typical person spent 96% of the day between 70 and 140, and 2.1% of it above 140, about 30 minutes a day.
Lean, healthy volunteers, so it’s close to the best case.
560 adults with normal blood tests
Framingham Heart Study, mean age 58.5, Dexcom G6 Pro for a week or more. Spartano and colleagues, 2025
87% of the day between 70 and 140, about 3 hours a day above 140 (12.1%), and a little over 15 minutes above 180.
Older than the first group, and 93% non-Hispanic white.
In a 2018 study of 57 adults, about a quarter of the people with normal standard tests had what the researchers called a severe pattern on a sensor, reaching the prediabetes range up to 15% of the time. Those people had normal A1c and fasting numbers. Nobody knows yet whether that pattern predicts anything.
Why does a sensor make spikes look bigger?
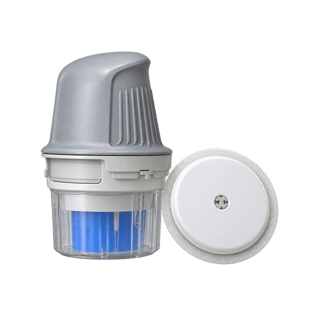
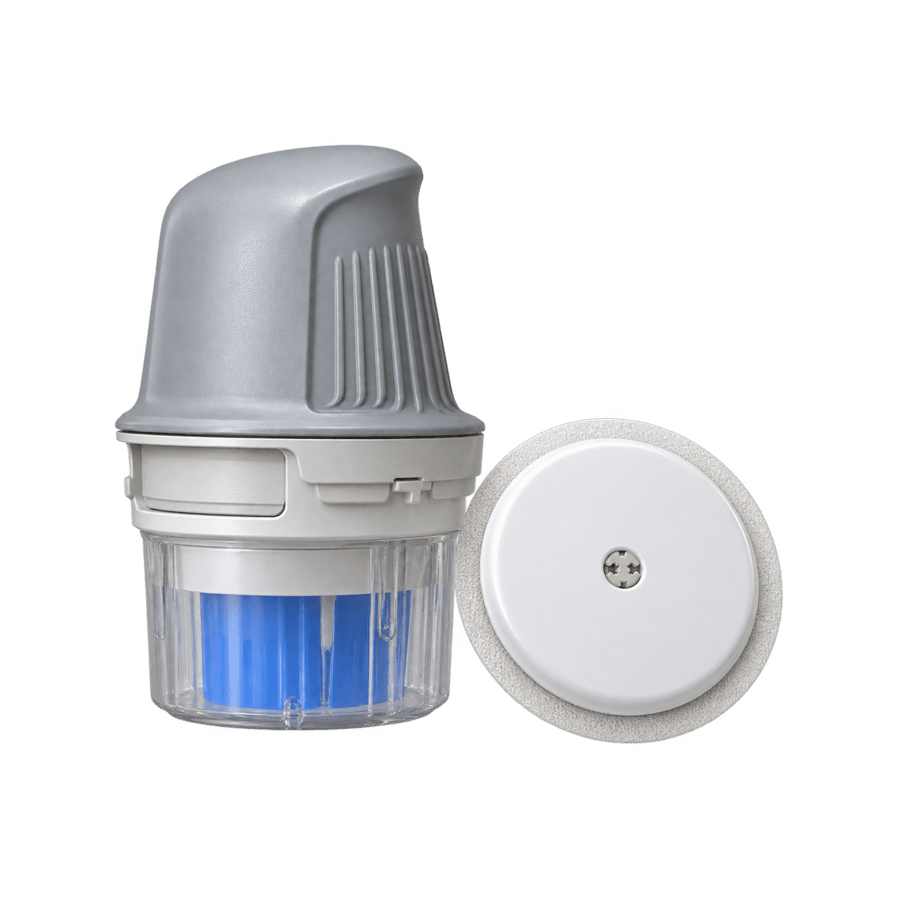
There are two reasons. A sensor measures sugar in the fluid between cells, not in the blood, and glucose takes 5 to 6 minutes to get there. And sensors run high. In a 2025 trial, 15 healthy adults wore a FreeStyle Libre 2 while giving fingertip blood every 15 minutes. The sensor ran about 16 mg/dL above the fingertip, which made their time above 140 look about 4 times bigger than it was. Even after each person’s own fasting gap was taken out, it still looked about 2 times bigger.
Some of the 160s on a sensor are 140s in your blood. Using a sensor to spot spikes is like weighing yourself on a bathroom scale that adds a few pounds, then worrying about the extra pounds.
What does predict trouble?
The lab tests do. In the DECODE study, researchers followed 25,364 Europeans for 7.3 years. Among people with the same fasting blood sugar, the risk of dying rose with the 2-hour number after the lab’s glucose drink. A high A1c and a fasting glucose in the diabetes range carry the same kind of weight.
Those tests measure something specific. The 2-hour test gives everyone the same 75 grams of glucose on an empty stomach and checks how well they’ve cleared it at exactly 2 hours. It’s a stress test of your whole system. A peak after a normal dinner, on a sensor that runs high, is a different measurement, and nobody has linked it to harm in people with normal lab numbers.
The best case for worrying about spikes
Spikes might matter
The 2-hour number predicts death. If clearing a big dose slowly is bad, clearing every meal slowly might be too.
Some healthy-looking people spike a lot. The 2018 study found a group with normal standard tests whose sensors went high often, and they may be on their way to prediabetes.
What we know so far
No trial has tested it. Nobody has shown that flattening normal hills after meals improves health in people without diabetes.
Wearing a sensor hasn’t been shown to help on its own. A 2026 review of 12 studies in people without diabetes concluded that “large, durable benefits and stand-alone efficacy are not established”.
The first side has a point. If your sensor shows most meals going well over 180 for a long time, that’s a reason to get a lab A1c and a 2-hour test, which can answer the question. A single hill after dinner doesn’t call for one.
What’s a reasonable way to use a sensor?
Use it to learn, for two weeks. People’s responses differ a lot. In a study of 800 people, identical meals gave very different hills from person to person. That makes a sensor good at answering your own questions, such as whether rolled oats or eggs make a smaller hill for you, whether a walk after dinner changes it, and what a late dinner does to your night.
Ignore the “time in range” on the app. Its usual target, more than 70% of the day between 70 and 180, is the ADA’s goal for many adults with diabetes. Healthy people sit at 87 to 96% of the day between 70 and 140. And if your lab numbers are normal, a hill after a meal is your body doing what it should.
9 sources
- Shah VN and others, Continuous glucose monitoring profiles in healthy nondiabetic participants, Journal of Clinical Endocrinology and Metabolism, 2019pmc.ncbi.nlm.nih.gov
- Spartano NL and others, Continuous glucose monitoring profiles in a community cohort without diabetes (Framingham Heart Study), Journal of Clinical Endocrinology and Metabolism, 2025pubmed.ncbi.nlm.nih.gov
- Hutchins KM and others, Continuous glucose monitor overestimates glycemia, with the magnitude of bias varying by postprandial test and individual, American Journal of Clinical Nutrition, 2025pmc.ncbi.nlm.nih.gov
- Basu A and others, Time lag of glucose from intravascular to interstitial compartment in humans, Diabetes, 2013pmc.ncbi.nlm.nih.gov
- DECODE Study Group, Glucose tolerance and mortality: comparison of WHO and American Diabetes Association diagnostic criteria, The Lancet, 1999pubmed.ncbi.nlm.nih.gov
- Hall H and others, Glucotypes reveal new patterns of glucose dysregulation, PLoS Biology, 2018pmc.ncbi.nlm.nih.gov
- Makkena VK and others, Continuous glucose monitoring in people without diabetes: a systematic review, Medicina, 2026pmc.ncbi.nlm.nih.gov
- American Diabetes Association, Standards of Care in Diabetes 2026, section 6, Glycemic Goals, Hypoglycemia, and Hyperglycemic Crisespmc.ncbi.nlm.nih.gov
- Zeevi D and others, Personalized nutrition by prediction of glycemic responses, Cell, 2015pubmed.ncbi.nlm.nih.gov