Does a glucose sensor show your real blood sugar?
Short answerSort of
On this page
Sort of. A sensor measures sugar in the fluid between the cells under your skin, not in your blood, and that fluid runs about 5 to 6 minutes behind. In a trial of healthy adults, a FreeStyle Libre 2 also ran about 16 mg/dL above fingertip blood. It’s good at showing the shape of your day and poor at any single number.
What we’d do
Trust a sensor for shapes and comparisons, such as which breakfast makes the smaller hill, whether the walk after dinner helps and what a late meal does to your night. Don’t trust it for a single number, and never for a diagnosis. When a number matters, check it with a finger stick, and take 5 to 27 mg/dL off the sensor in your head. For where you stand, use a lab A1c and fasting glucose.
If you remember three things
- A sensor measures the fluid under your skin. Sugar reaches it 5 to 6 minutes after your blood.
- In healthy adults, one ran about 16 mg/dL high. That made time over 140 look 4 times bigger.
- Its GMI isn’t your A1c. A healthy sensor average of 98 gives a GMI of 5.7%.
Why do people think a sensor is their blood sugar?
The number on the app looks exact. It updates every few minutes, it draws a smooth line, and it uses the same units as a lab test. It’s natural to treat 152 on your phone as 152 in your veins, and to compare it with lab cutoffs like 140.
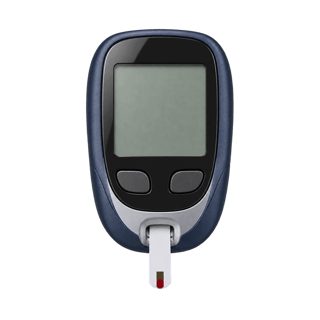
Then people check with a finger stick and get 131, or see a peak on the sensor a few minutes after the meter already came down, and wonder which one is broken. Neither one is. They’re measuring two different places.
What does a sensor actually measure?
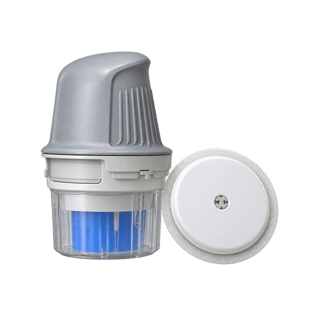
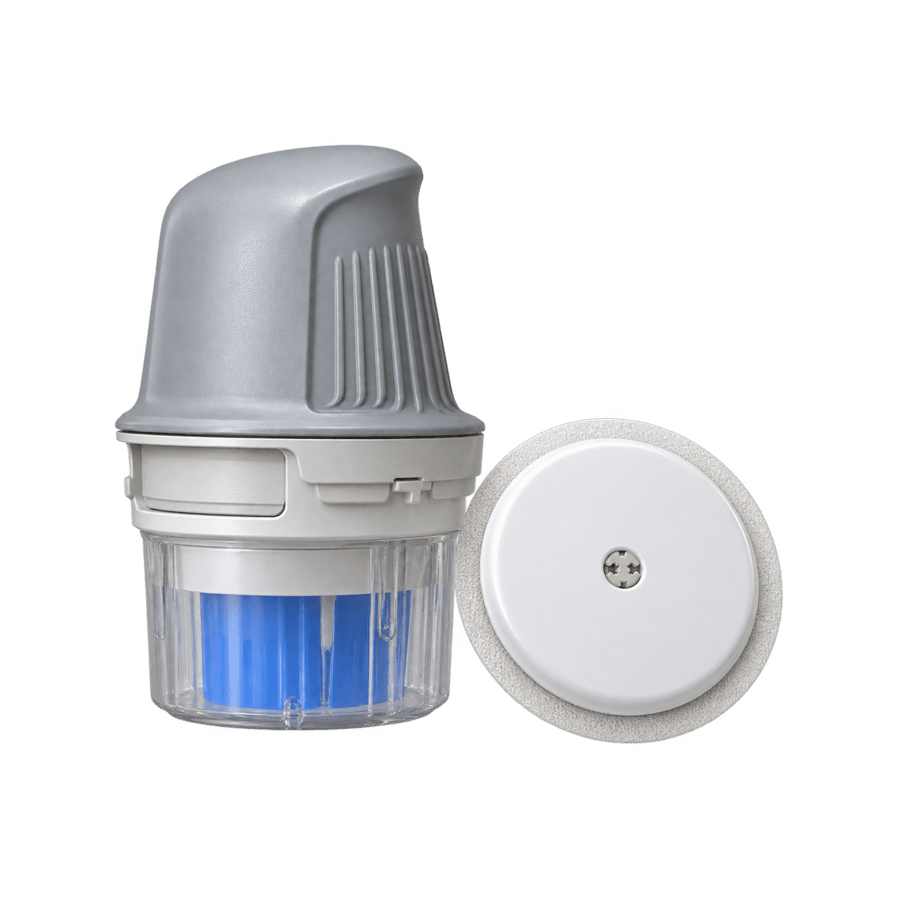
A sensor puts a hair-thin filament just under your skin, into the fluid that bathes your cells (the interstitial fluid). Sugar leaves your blood vessels and spreads into that fluid, and the filament measures it there.
That trip takes time. In a 2013 study, researchers measured how long glucose took to move from the blood into the fluid under the skin in 8 healthy, fasted adults. It took 5 to 6 minutes (5.3 to 6.2). When your blood sugar is steady, the delay barely matters. After a meal or during exercise, when blood sugar moves fast, the sensor is always a few minutes behind the real thing.
A sensor is like the speedometer in an old car. It’s very good at telling you whether you’re speeding up or slowing down, and a few miles an hour off on the exact number.
How far off is it?
The most careful test in healthy people came in 2025.
Libre 2 against fingertip blood
15 healthy adults, 7 lab visits each, fingertip blood every 15 minutes. Hutchins and colleagues, 2025
The sensor ran 0.9 mmol/L, about 16 mg/dL, above fingertip blood when fasting, and the same after meals and drinks. For about two in three people the gap was between 5 and 27 mg/dL. That made time above 140 look about 4 times bigger than fingertip blood said, and still about 2 times bigger once each person’s own fasting gap was taken out. The sensor scored a smoothie’s glycemic index at 69, against 53 by fingertip.
One sensor model, 15 people. The study was funded by an unrestricted grant from a juice maker.
Bias also varied from person to person and from food to food, which is why taking a fixed number off only gets you close. Is my sensor running high? shows the likely fingertip range for your number. A sensor at 150 gives a likely fingertip number of about 123 to 145.
Why is my sensor’s GMI different from my A1c?
The GMI on a sensor report comes from a formula. It was built from 528 people with diabetes and turns your sensor average into an A1c-like number: 3.31 plus 0.02392 times your average in mg/dL.
Run healthy people through it and the problem shows. In 153 healthy people aged 7 to 80, the average sensor glucose was about 98 mg/dL. The formula turns 98 into a GMI of 5.7%, the first number of the prediabetes range. The formula’s authors published an update in 2026 after finding the old one ran more than 0.4 points off when lab A1c was under 5.5%, but the new formula isn’t public yet. Trust the lab A1c.
Can a sensor diagnose prediabetes?
No. The ADA diagnoses diabetes and prediabetes from lab tests, meaning a fasting glucose, a 2-hour glucose drink test or an A1c from a certified lab, with two abnormal results unless the number is clearly high. When the FDA cleared the first over-the-counter sensor, Dexcom’s Stelo, on March 5, 2024, its announcement said users shouldn’t make medical decisions from the device without talking to their doctor.
The best case for trusting the sensor
Sensors are good
People with diabetes run their lives on them. The ADA’s own goals for many adults with diabetes are written in sensor terms, such as more than 70% of the day between 70 and 180.
They see what a finger stick can’t. Overnight, after every meal, during exercise, without a single prick.
But not for single numbers
The bias is big next to healthy ranges. A 16 mg/dL gap is the whole distance between a sensor’s 156 and a fingertip’s 140.
It varies. Different people and different foods had different gaps in the same trial.
The two fit together. For someone with diabetes on insulin, a sensor’s trends and alarms are what matter. For someone without diabetes checking whether a meal “spiked”, the bias is about the same size as the thing they’re trying to see.
How should you use a sensor, then?
Compare like with like on the same sensor, such as rolled oats against instant oats on two mornings, or the same dinner with and without a walk. That cancels part of the bias, because it’s the same sensor on the same arm both times.
Don’t compare your numbers with someone else’s, or with a lab cutoff, and don’t let a GMI stand in for an A1c. If a number worries you, check it with a finger stick, and if it still worries you, get a lab test.
8 sources
- Basu A and others, Time lag of glucose from intravascular to interstitial compartment in humans, Diabetes, 2013pmc.ncbi.nlm.nih.gov
- Hutchins KM and others, Continuous glucose monitor overestimates glycemia, with the magnitude of bias varying by postprandial test and individual, American Journal of Clinical Nutrition, 2025pmc.ncbi.nlm.nih.gov
- US Food and Drug Administration, FDA clears first over-the-counter continuous glucose monitor, March 5, 2024fda.gov
- Shah VN and others, Continuous glucose monitoring profiles in healthy nondiabetic participants, Journal of Clinical Endocrinology and Metabolism, 2019pmc.ncbi.nlm.nih.gov
- Bergenstal RM and others, Glucose management indicator (GMI): a new term for estimating A1C from continuous glucose monitoring, Diabetes Care, 2018pmc.ncbi.nlm.nih.gov
- Bergenstal RM and others, updated glucose management indicator, Diabetologia, 2026pubmed.ncbi.nlm.nih.gov
- American Diabetes Association, Standards of Care in Diabetes 2026, section 6, Glycemic Goals, Hypoglycemia, and Hyperglycemic Crisespmc.ncbi.nlm.nih.gov
- American Diabetes Association, Standards of Care in Diabetes 2026, section 2, Diagnosis and Classification of Diabetespmc.ncbi.nlm.nih.gov