What your numbers mean
On this page
- Why are blood sugar numbers so confusing?
- What are the normal ranges?
- What does each test actually measure?
- What average blood sugar does an A1c stand for?
- Why is one test never a diagnosis?
- Does normal blood sugar change with age?
- What about numbers after a meal or on a sensor?
- How often should you get tested?
Fasting under 100 mg/dL (5.6 mmol/L), under 140 (7.8) two hours after the lab’s glucose drink, and an A1c under 5.7% (39 mmol/mol) are normal in the US. A fasting 100 to 125 or an A1c of 5.7 to 6.4% is the prediabetes range. One result is never a diagnosis on its own, and only a lab test decides a band.
What we’d do
Ask for a fasting glucose and an A1c from the same blood draw, since together they catch more than either alone. If one lands in the prediabetes range, treat it as an early warning, start on weight and walking now, and retest in 12 weeks. If one lands in the diabetes range, book the second test this week. Don’t take a finger stick, a sensor or a home kit as a diagnosis, in either direction.
If you remember three things
- 100 fasting and 5.7% A1c are where the prediabetes range starts. It doesn’t wait for 110 or 6%.
- A diagnosis takes two abnormal results unless the number is clearly high. One morning proves nothing.
- The lines are the same at every adult age. Don’t excuse a high number as getting older.
Why are blood sugar numbers so confusing?
There are four tests with four sets of lines, two units on every one of them, and a sensor that gives you a number every few minutes with no official line at all. Many people also carry an old number in their head, like an A1c of 6% as the point to start worrying. The prediabetes range starts lower, at 5.7%.
The other confusion is about what one number can say. A fasting glucose is one morning. An A1c is about three months. A sensor peak after lunch is one meal, measured in the fluid under your skin. They answer different questions, and they often disagree.
What are the normal ranges?
These are the American Diabetes Association’s 2026 lines, the ones US labs and doctors use.
| Test | Normal | Prediabetes range | Diabetes range |
|---|---|---|---|
| Fasting glucose | under 100 mg/dL (5.6 mmol/L) | 100 to 125 (5.6 to 6.9) | 126 (7.0) or more |
| 2 hours after a 75 g glucose drink | under 140 (7.8) | 140 to 199 (7.8 to 11.0) | 200 (11.1) or more |
| A1c | under 5.7% (39 mmol/mol) | 5.7 to 6.4% (39 to 47) | 6.5% (48) or more |
| Any time of day | no band | no band | 200 (11.1) or more with strong thirst, peeing a lot, blurry vision or weight loss you didn’t try for |
To turn mg/dL into mmol/L, divide by 18. An A1c in % becomes mmol/mol with the NGSP’s equation, so 5.7% is 39 and 6.5% is 48.
A few worked examples, from the same math as the checker. A fasting 96 mg/dL (5.3 mmol/L) is normal and 4 points under the prediabetes line. A fasting 104 (5.8) is in the prediabetes range, 5 points from normal and 22 under the diabetes line. An A1c of 5.8% is in the prediabetes range, 0.2 points from normal.
What does each test actually measure?
Think of the fasting glucose as a photo and the A1c as a three-month video that shows the last month most.
Fasting glucose is your blood sugar after at least 8 hours with no calories, so water only. Milk or sugar in your coffee breaks the fast. It mostly shows what your liver is doing overnight, and it moves from day to day with sleep, stress and what you ate the night before.
The 2-hour test (the oral glucose tolerance test) is a fasting draw, a drink with 75 grams of glucose, and a second draw 2 hours later. It measures how fast you clear a big, fixed dose. It’s the test with the longest record. In the DECODE study, which followed 25,364 Europeans for 7.3 years, the risk of dying rose with the 2-hour number even among people whose fasting number was the same.
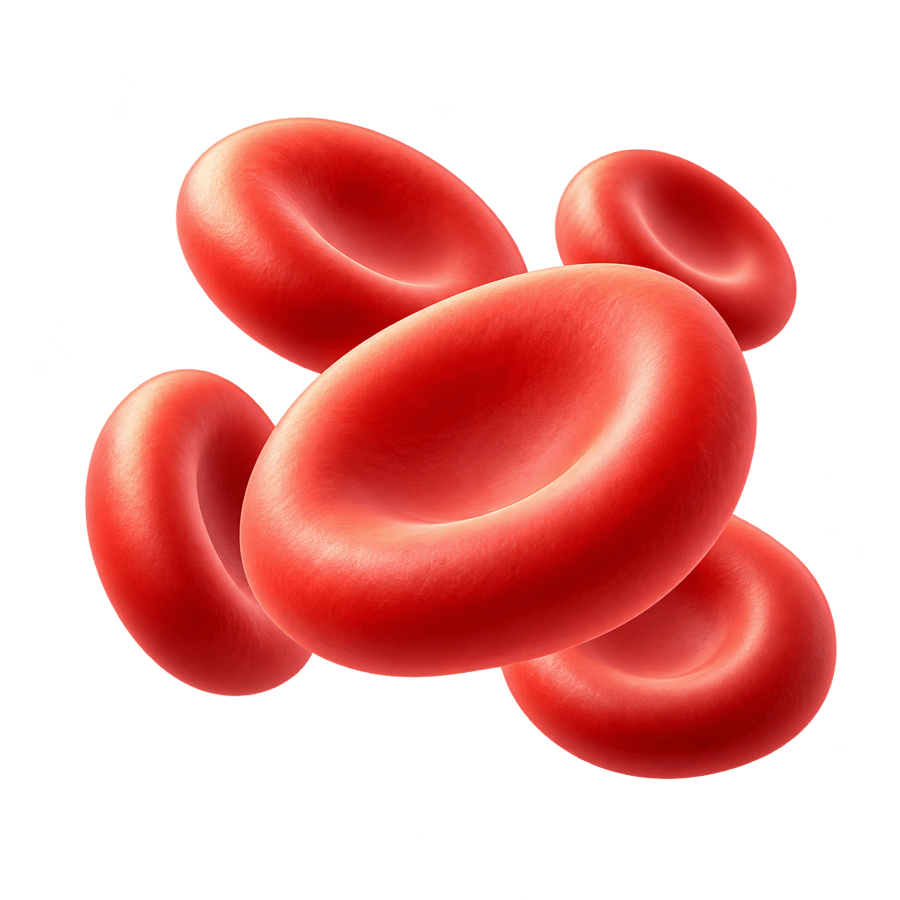
A1c is the share of hemoglobin in your red blood cells with sugar stuck to it. Red cells live for a few months and pick up sugar the whole time, so A1c is an average. It weighs the latest weeks most. After blood sugar came down in 9 people newly diagnosed with type 2, their A1c fell with a half-time of about 35 days, looking back about 100 days in all.
What average blood sugar does an A1c stand for?
In the ADAG study, 507 adults wore sensors and did finger sticks for 3 months while their A1c was measured. Average glucose came out at 28.7 times A1c minus 46.7, in mg/dL. By that equation, 5.7% stands for an average near 117 mg/dL, and 6% for about 126.
The range around each value is wide. An A1c of 6% fit an average anywhere from 100 to 152 mg/dL. Part of the reason is red cell age, which differs from person to person. In 6 people without diabetes, the average red cell was 38 to 60 days old, enough to shift A1c for the same blood sugar. Put yours into the A1c converter for the average and its range.
Why is one test never a diagnosis?
Every number moves. A fasting glucose shifts with a bad night or a late meal, and labs have their own small errors. That’s why the ADA asks for two abnormal results before a diagnosis. They can be two different tests from the same blood draw, say a fasting glucose and an A1c, or the same test on two days. The exception is a number that’s clearly high, such as 200 or more with the symptoms above.
A1c also has blind spots. It can be thrown off by anemia, recent blood loss, sickle cell trait and other hemoglobin variants, G6PD deficiency, pregnancy and some HIV treatment. That’s another reason to pair it with a fasting glucose.
Does normal blood sugar change with age?
The lines don’t. The averages creep up a little. A1c rose about 0.01 points a year in adults without diabetes, about 0.1 a decade, in two US studies with 5,743 people between them. On a sensor, healthy people under 60 averaged about 98 mg/dL and people over 60 about 104. Those shifts are small next to the gap between 5.6% and 6.4%, so a number in the prediabetes range at 65 means the same as it does at 35.
What about numbers after a meal or on a sensor?
There’s no official band for a normal meal. The 140 line comes from the lab’s glucose drink at exactly 2 hours, so a home check after dinner is only a rough match for it. A peak of 140 within an hour of eating is ordinary. In 153 healthy people aged 7 to 80 wearing a sensor, the typical person spent about 30 minutes a day above 140, and 96% of the day between 70 and 140. Sensors also run higher than fingertip blood. The details are in how to measure it.
A low is under 70 mg/dL (3.9 mmol/L), and under 54 (3.0) is serious. What to do about one is on when to see a doctor.
How often should you get tested?
The ADA’s 2026 standards say everyone should start at 35, and earlier if your BMI is 25 or more (23 or more with Asian ancestry) and you have another risk factor, such as a parent or sibling with diabetes or high blood pressure. A normal result means testing again at least every 3 years. A result in the prediabetes range means testing every year. Women who had diabetes in a pregnancy should test at least every 1 to 3 years. The US Preventive Services Task Force asks for screening in adults 35 to 70 with overweight or obesity.
Most people in the range never hear about it. 8 in 10 American adults with prediabetes don’t know they have it, so if your last test was more than 3 years ago, ask for one. The quiz scores your risk the way the CDC does and dates your next test.
11 sources
- American Diabetes Association, Standards of Care in Diabetes 2026, section 2, Diagnosis and Classification of Diabetespmc.ncbi.nlm.nih.gov
- American Diabetes Association, Standards of Care in Diabetes 2026, section 6, Glycemic Goals, Hypoglycemia, and Hyperglycemic Crisespmc.ncbi.nlm.nih.gov
- US Preventive Services Task Force, Screening for prediabetes and type 2 diabetes, 2021uspreventiveservicestaskforce.org
- Nathan DM and others, Translating the A1C assay into estimated average glucose values (ADAG), Diabetes Care, 2008pmc.ncbi.nlm.nih.gov
- NGSP, IFCC standardization of HbA1c, the master equationngsp.org
- Tahara Y and Shima K, Kinetics of HbA1c, glycated albumin, and fructosamine and analysis of their weight functions against preceding plasma glucose level, Diabetes Care, 1995pubmed.ncbi.nlm.nih.gov
- Cohen RM and others, Red cell life span heterogeneity in hematologically normal people is sufficient to alter HbA1c, Blood, 2008pmc.ncbi.nlm.nih.gov
- Pani LN and others, Effect of aging on A1C levels in individuals without diabetes, Diabetes Care, 2008pmc.ncbi.nlm.nih.gov
- Shah VN and others, Continuous glucose monitoring profiles in healthy nondiabetic participants, Journal of Clinical Endocrinology and Metabolism, 2019pmc.ncbi.nlm.nih.gov
- DECODE Study Group, Glucose tolerance and mortality: comparison of WHO and American Diabetes Association diagnostic criteria, The Lancet, 1999pubmed.ncbi.nlm.nih.gov
- CDC, Prediabetes: could it be you? Updated February 17, 2026cdc.gov