What a CGM can tell you, and what it can't
On this page
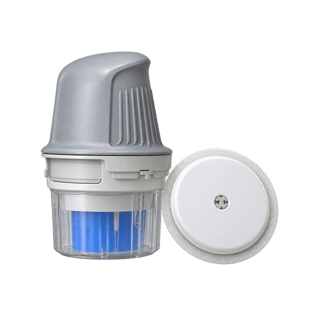
A CGM is good at shapes. It shows how your blood sugar moves through a day, which of your meals make the biggest hills, what a walk after dinner does and what happens overnight. It’s bad at single numbers. It runs higher than your blood and a few minutes behind it, and it can’t tell you whether you have prediabetes or diabetes. Only a lab test can.
What we’d do
Use a sensor to compare your own meals and habits with each other, not to judge a single number. Ignore the 70% “time in range” goal on the app, which was set for people with diabetes. And get your A1c from a lab, since the sensor’s estimate runs high in healthy people.
Why sensor numbers scare people
The first week with a sensor, most people see a number over 140 mg/dL after a meal and wonder if something’s wrong. The app shows a “time in range” score and a GMI that looks like an A1c. It all looks medical.
But a healthy person’s sensor goes over 140 every day. In 153 healthy, non-obese people aged 7 to 80, the typical person spent about 30 minutes a day above 140. In 560 adults with normal blood tests in the Framingham Heart Study, average age 58, it was about 3 hours a day.
What it can tell you
- The shape of your day. When your hills come, how high and how long, and what your nights look like.
- Your meals, compared with each other. The same breakfast with eggs first, or a walk after dinner against no walk. More in what a CGM shows about your meals.
- Patterns over two weeks. Whether your biggest hills come at dinner or after sweet drinks, or after short nights.
What it can’t tell you
Whether you have prediabetes. The bands that decide that come from a lab: a fasting glucose, an A1c or a 2-hour test after the lab’s glucose drink (ADA 2026). The FDA says users of Stelo “should not make medical decisions based on the device’s output without talking to their healthcare provider.”
An exact number. The sensor measures the fluid between your cells, and glucose takes 5 to 6 minutes to get there from your blood. In 15 healthy adults, one popular sensor ran about 16 mg/dL above fingertip blood and overstated the time above 140 about 4-fold, or about 2-fold once each person’s fasting offset was removed.
Your A1c. Apps print a GMI, a formula that turns two weeks of sensor readings into an A1c-like number. It was built from people with diabetes. A healthy sensor average of 98 mg/dL gives a GMI of 5.7%, the first prediabetes number, partly because sensors run high. Trust the lab. More in why is my GMI different from my A1c?
Whether your hills are hurting you. Nobody has shown that flattening normal hills improves health in people without diabetes. A high lab A1c and a high 2-hour number after the glucose drink predict trouble. A hill after pasta doesn’t.
The time in range trap
Most apps grade your day by “time in range,” usually 70 to 180 mg/dL, with a goal of more than 70%. That goal comes from the ADA’s standards for many adults with diabetes. Healthy people spent 87 to 96% of the day in the tighter 70 to 140 range. So a 75% day isn’t a pass if you don’t have diabetes, and a single hill over 140 isn’t a fail.
When a sensor number is a reason to act
Lows are the exception. Under 70 mg/dL with shakiness or sweating needs fast sugar, and under 54 is serious (ADA 2026). Since a sensor can be off from your blood, check a low with a finger stick. If your sensor average or time above 140 sits well above both healthy groups for days, book a lab A1c and fasting glucose. Is my sensor running high? puts your numbers next to theirs.
8 sources
- Shah VN and others, Continuous glucose monitoring profiles in healthy nondiabetic participants, Journal of Clinical Endocrinology and Metabolism, 2019pmc.ncbi.nlm.nih.gov
- Spartano NL and others, blinded continuous glucose monitoring in the Framingham Heart Study, Journal of Clinical Endocrinology and Metabolism, 2025pubmed.ncbi.nlm.nih.gov
- Hutchins KM and others, Continuous glucose monitor overestimates glycemia, with the magnitude of bias varying by postprandial test and individual, American Journal of Clinical Nutrition, 2025pmc.ncbi.nlm.nih.gov
- Basu A and others, Time lag of glucose from intravascular to interstitial compartment in humans, Diabetes, 2013pmc.ncbi.nlm.nih.gov
- Bergenstal RM and others, Glucose management indicator (GMI): a new term for estimating A1C from continuous glucose monitoring, Diabetes Care, 2018pmc.ncbi.nlm.nih.gov
- American Diabetes Association, Standards of Care in Diabetes 2026, section 2, Diagnosis and Classification of Diabetespmc.ncbi.nlm.nih.gov
- American Diabetes Association, Standards of Care in Diabetes 2026, section 6, Glycemic Goals and Hypoglycemiapmc.ncbi.nlm.nih.gov
- US Food and Drug Administration, FDA clears first over-the-counter continuous glucose monitor, March 5, 2024fda.gov