Why is my GMI different from my A1c?
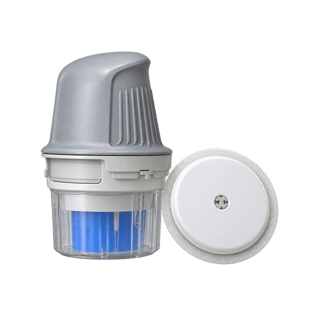
GMI turns a sensor’s average glucose into a number that looks like an A1c, using a formula. Sensors run higher than your blood, and the formula was built from people with diabetes, so a healthy person’s sensor average of 98 mg/dL gives a GMI of 5.7%, the first number of the prediabetes range. Trust the lab A1c.
What we’d do
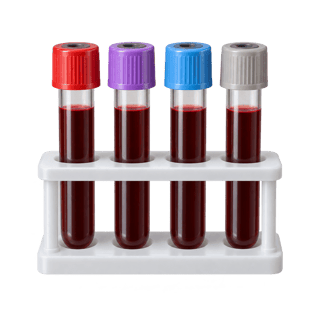
Use GMI to compare your own weeks with each other, and use a lab A1c to know where you stand. If your GMI says 5.7 or more and you’ve never had a lab A1c, book one before you worry. A sensor can’t diagnose anything.
Why it’s confusing
The sensor app puts a GMI on the summary screen, formatted exactly like an A1c, right where you’d expect a verdict. It used to be called “estimated A1c”. Plenty of patients and doctors were confused or frustrated when it didn’t match the lab, the US Food and Drug Administration decided the name had to change, and in 2018 the researchers renamed it the glucose management indicator.
How GMI is worked out
GMI (%) = 3.31 + 0.02392 × your sensor’s average glucose in mg/dL. The formula came from clinical trials of people with diabetes wearing sensors. Run healthy people’s numbers through it and you get a surprise.
| Sensor average | GMI | A1c by the older ADAG formula |
|---|---|---|
| 98 mg/dL (healthy people under 60) | 5.7% | 5.0% |
| 104 mg/dL (healthy people over 60) | 5.8% | 5.3% |
| 110 mg/dL | 5.9% | 5.5% |
| 126 mg/dL | 6.3% | 6.0% |
The 98 and 104 come from 153 healthy people aged 7 to 80 wearing a blinded Dexcom G6. The right column runs the same averages through the formula from the 2008 ADAG study, which included 80 people without diabetes and matched lab A1c to average blood sugar from both sensors and finger sticks. Same average, two formulas, and they disagree by up to 0.7 points at the healthy end.
Three reasons they disagree
- The sensor runs high. In 15 healthy adults, a FreeStyle Libre 2 ran about 16 mg/dL above fingertip blood. A sensor average that’s 16 points too high pushes GMI up by about 0.4.
- The formula was off at the low end. In 2026 the same research group tested GMI against lab A1c in 18,860 people and found the old formula was off by more than 0.4 points when lab A1c was under 5.5%. Their updated GMI cut that gap to 0.1, but the new formula isn’t public yet.
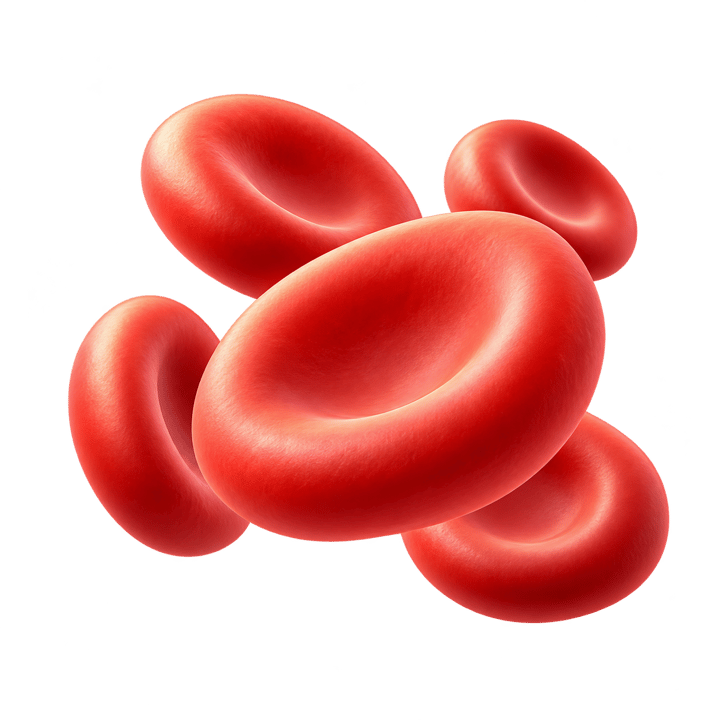
- Your red cells. A1c depends on how long your red cells live as well as your blood sugar. In healthy people the average red cell was anywhere from 38 to 60 days old, enough to shift A1c for the same blood sugar.
It’s like guessing someone’s height from their shoe size. The formula is fine on average, but it was fitted to one group of people, and your feet might not follow the rule.
When GMI is useful
GMI is good at tracking direction. If your sensor average falls from 110 to 100 over a month of after-dinner walks, the GMI falls too, and that change tells you more than the number itself. The A1c converter turns a sensor average into a GMI and shows it beside a lab A1c, and is my sensor running high? shows what your fingertip would likely say.
6 sources
- Bergenstal RM and others, Glucose Management Indicator (GMI): a new term for estimating A1C from continuous glucose monitoring, Diabetes Care, 2018pmc.ncbi.nlm.nih.gov
- Bergenstal RM and others, Updated glucose management indicator (GMI) better aligns with HbA1c than current GMI, Diabetologia, 2026pubmed.ncbi.nlm.nih.gov
- Shah VN and others, Continuous glucose monitoring profiles in healthy nondiabetic participants: a multicenter prospective study, Journal of Clinical Endocrinology and Metabolism, 2019pmc.ncbi.nlm.nih.gov
- Hutchins KM and others, Continuous glucose monitor overestimates glycemia, with the magnitude of bias varying by postprandial test and individual, American Journal of Clinical Nutrition, 2025pmc.ncbi.nlm.nih.gov
- Nathan DM and others, Translating the A1C assay into estimated average glucose values, Diabetes Care, 2008pmc.ncbi.nlm.nih.gov
- Cohen RM and others, Red cell life span heterogeneity in hematologically normal people is sufficient to alter HbA1c, Blood, 2008pmc.ncbi.nlm.nih.gov