What is a normal A1c?
On this page
Under 5.7% (39 mmol/mol). An A1c of 5.7 to 6.4% (39 to 47) is the prediabetes range, and 6.5% (48) or more on two tests is diabetes. Anemia, recent blood loss and some hemoglobin variants can throw it off, so pair it with a fasting glucose. The lines are the same at every adult age.
What we’d do
Get your A1c and a fasting glucose from the same blood draw, so each one checks the other. Under 5.7 with a normal fasting number means you can test again in 3 years. 5.7 or more means it’s time to start the plan and retest in 12 weeks.
Why the number confuses people
It’s a percent, but it isn’t a percent of anything you’ve heard of. Some labs report it in mmol/mol instead, sensor apps show a “GMI” that looks like it, and some reports print an “average glucose” beside it. All four can describe the same blood.
What the percent means
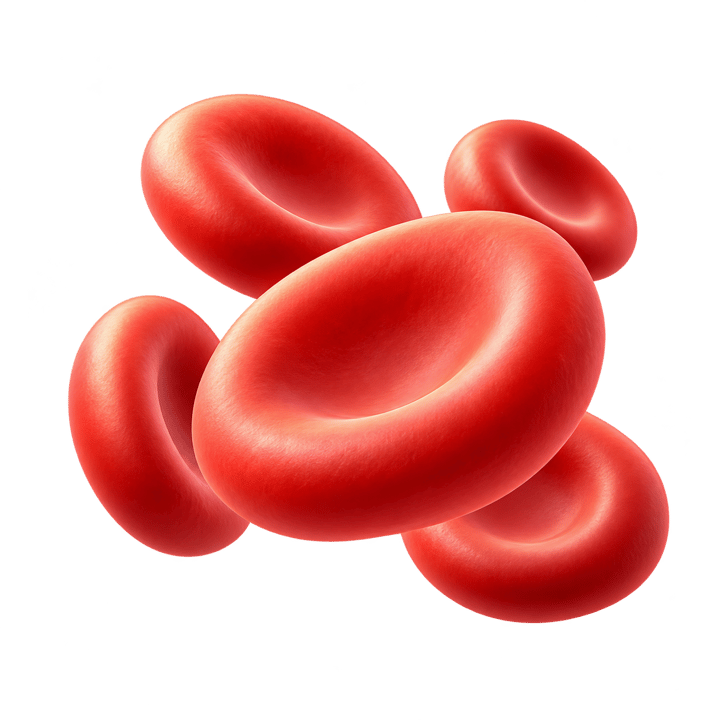
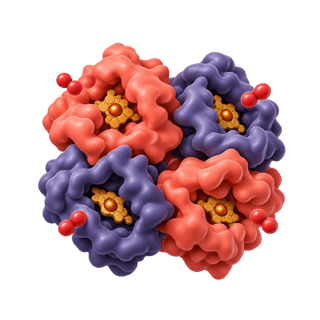
A1c is the share of the hemoglobin in your red cells that has sugar stuck to it. In someone with an A1c of 5.5%, 5.5 out of every 100 hemoglobin molecules carry sugar. Red cells pick it up as they age, so the number shows your average blood sugar over the last few months, with the most recent weeks counting most.
The study that linked A1c to average glucose followed 507 adults, 80 of them without diabetes, for 3 months each. Its formula is average glucose (mg/dL) = 28.7 × A1c − 46.7, so each 0.1 on your A1c is about 3 mg/dL of average blood sugar.
| A1c | mmol/mol | Average glucose | Band |
|---|---|---|---|
| 5.0% | 31 | 97 mg/dL | normal |
| 5.4% | 36 | 108 mg/dL | normal |
| 5.7% | 39 | 117 mg/dL | prediabetes range |
| 6.0% | 42 | 126 mg/dL | prediabetes range |
| 6.4% | 46 | 137 mg/dL | prediabetes range |
| 6.5% | 48 | 140 mg/dL | diabetes range |
| 7.0% | 53 | 154 mg/dL | diabetes range |
The whole normal range is a narrow window. The difference between an A1c of 5.0 and 5.6 is an average of about 17 mg/dL, about as much as a sensor ran above fingertip blood in one small trial.
When A1c gets it wrong
A1c assumes your red cells live a normal life span, and they don’t always. Anemia, iron levels, blood loss, a transfusion, some hemoglobin variants such as sickle cell trait, G6PD deficiency and HIV all change the link between A1c and blood sugar (American Diabetes Association, 2026). Kidney failure, liver disease, opioids and pregnancy can too (MedlinePlus). Even in healthy people, the average red cell was anywhere from 38 to 60 days old, and in a small study that spread alone was enough to shift A1c for the same blood sugar.
Two tests, and age
A diagnosis takes two abnormal results unless blood sugar is clearly high. Two A1c results of 6.5% or more count even when the fasting glucose is normal. A1c also drifts up about 0.1 points a decade in people without diabetes, but the lines don’t move with age.
You don’t need to fast for an A1c, and the ADA lists that, along with fewer swings from stress or illness, as its advantages over a fasting test. Convert any value on the A1c converter, see every value from 4.5 to 10 as its own page, or start with what an A1c of 5.7 means.
6 sources
- American Diabetes Association, Standards of Care in Diabetes 2026, section 2, Diagnosis and Classification of Diabetespmc.ncbi.nlm.nih.gov
- Nathan DM and others, Translating the A1C assay into estimated average glucose values, Diabetes Care, 2008pmc.ncbi.nlm.nih.gov
- Pani LN and others, Effect of aging on A1C levels in individuals without diabetes, Diabetes Care, 2008pmc.ncbi.nlm.nih.gov
- MedlinePlus, Hemoglobin A1C (HbA1c) test, US National Library of Medicinemedlineplus.gov
- Hutchins KM and others, Continuous glucose monitor overestimates glycemia, with the magnitude of bias varying by postprandial test and individual, American Journal of Clinical Nutrition, 2025pmc.ncbi.nlm.nih.gov
- Cohen RM and others, Red cell life span heterogeneity in hematologically normal people is sufficient to alter HbA1c, Blood, 2008pmc.ncbi.nlm.nih.gov