How accurate are glucose sensors?
On this page
Good for shapes, loose for single numbers. In 15 healthy adults, a FreeStyle Libre 2 ran about 16 mg/dL above fingertip blood, and more in some people than others. A sensor also measures the fluid under your skin, which trails your blood by 5 to 6 minutes. Use it to compare meals with each other, and use a lab test for where you stand.
What we’d do
Trust the shape of the curve and the comparison between meals. Don’t trust a single number enough to worry about it. If a sensor number surprises you, check it with a finger stick, and if your sensor average looks high, book a lab A1c before anything else.
Why it looks so precise
A sensor shows a number to the single mg/dL, every few minutes, with a smooth line and an arrow. That looks like a lab result, and it’s easy to assume it’s as exact as one. It’s measuring something a little different from your blood, though, and a small trial in 2025 showed how far off it can run.
What a sensor measures
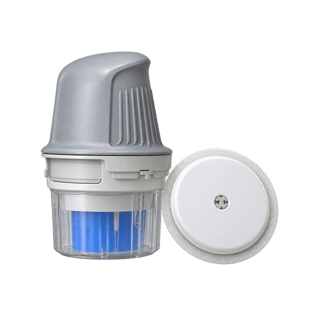
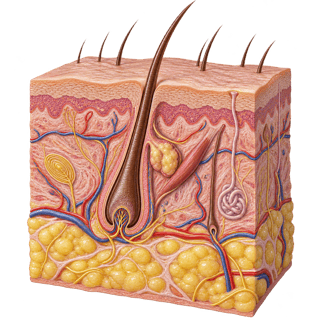
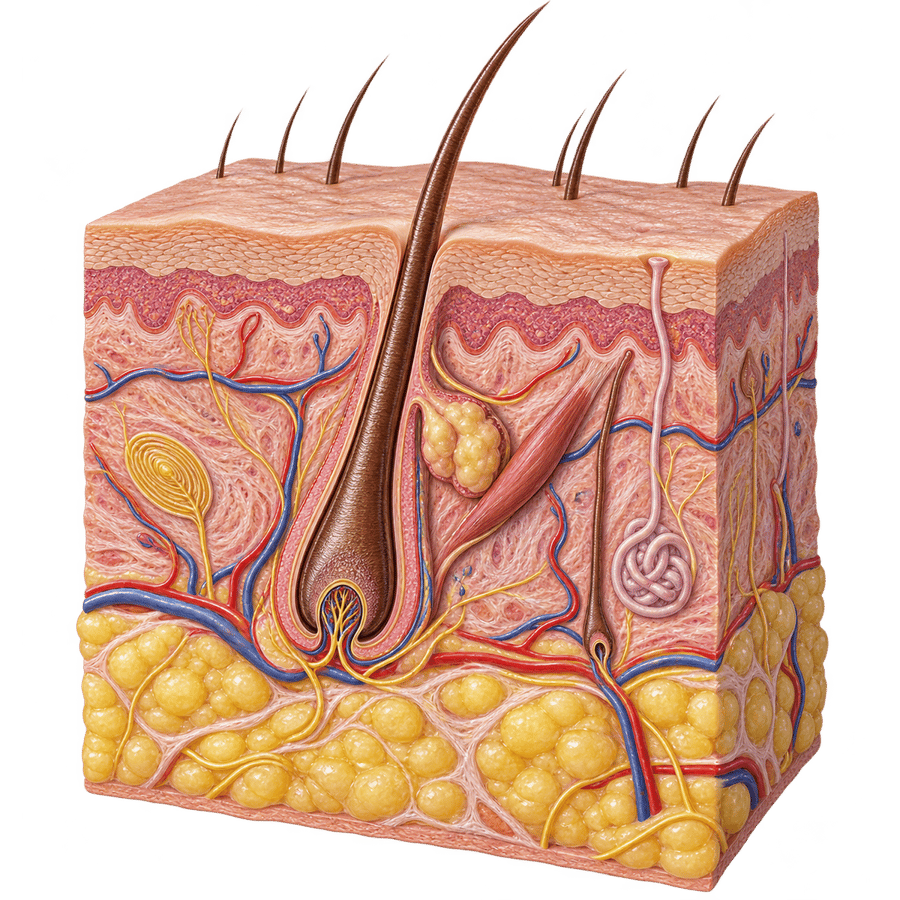
A sensor’s thin filament sits in the fluid between your cells, just under the skin, not in a blood vessel. Sugar moves from your blood into that fluid, and it takes time. In 8 healthy adults, researchers traced glucose from the bloodstream into that fluid and found the delay was 5 to 6 minutes.
It’s like a thermometer in the hallway instead of the room. It follows the room closely, but it’s always a little behind and never quite the same.
How far off it ran
In 2025, researchers had 15 healthy adults, 9 women and 6 men, make 7 lab visits each. At each visit they had glucose, whole fruit, blended fruit or a fruit smoothie, and the team checked a FreeStyle Libre 2 against fingertip blood every 15 minutes for 2 hours.
| What they checked | Sensor against fingertip |
|---|---|
| Fasting glucose | 0.9 mmol/L (about 16 mg/dL) higher on average |
| After food or drink | 0.9 mmol/L (about 16 mg/dL) higher on average |
| Time above 140 mg/dL | about 4 times too much |
| Time above 140, after taking out each person’s fasting offset | still about 2 times too much |
| Glycemic index of a smoothie | 69 by sensor, 53 by fingertip |
The gap also varied from person to person. Going by the spread in that trial, for about two in three people a sensor number ran somewhere between 5 and 27 mg/dL above fingertip blood. A sensor 140 would be roughly 113 to 135 at the fingertip. The study was funded by an unrestricted grant from a juice maker, which had no role in it apart from supplying the test drinks.
What that means for your report
The shape is the part you can use. Comparing your own meals works much better than trusting single numbers, though the trial found the sensor’s error shifted a little from food to food, so a small difference between two meals doesn’t tell you much. A big difference does. Healthy people on a sensor average about 98 mg/dL and spend about 30 minutes a day above 140, and some of that is the sensor running high.
What a sensor can’t do
When the FDA cleared the first over-the-counter sensor, it said users shouldn’t make medical decisions from its numbers without talking to a provider. A diagnosis comes from a lab fasting glucose, a 2-hour glucose drink test or an A1c (American Diabetes Association, 2026). A sensor can tell you it’s time to get one.
See your own numbers with the sensor’s likely bias taken off in is my sensor running high? The longer story is in does a glucose sensor show your real blood sugar?
5 sources
- Hutchins KM and others, Continuous glucose monitor overestimates glycemia, with the magnitude of bias varying by postprandial test and individual, American Journal of Clinical Nutrition, 2025pmc.ncbi.nlm.nih.gov
- Basu A and others, Time lag of glucose from intravascular to interstitial compartment in humans, Diabetes, 2013pmc.ncbi.nlm.nih.gov
- Shah VN and others, Continuous glucose monitoring profiles in healthy nondiabetic participants: a multicenter prospective study, Journal of Clinical Endocrinology and Metabolism, 2019pmc.ncbi.nlm.nih.gov
- US Food and Drug Administration, FDA clears first over-the-counter continuous glucose monitor, March 5, 2024fda.gov
- American Diabetes Association, Standards of Care in Diabetes 2026, section 2, Diagnosis and Classification of Diabetespmc.ncbi.nlm.nih.gov